
By Michael Burke
Chancellor George Osborne has recently been promoting two ideas. One is that a recovery is under way and the other is that further cuts in government spending are needed, up to £25bn.
The contradictory nature of those two statements tells us something important about the nature of the current recovery and the actual content of economic policy. It is clear that however weak the current recovery is, the overwhelming bulk of the population will not benefit from it. Austerity policies have always been aimed at transferring incomes from labour and the poor to capital and the rich. So for example, a VAT increase was said to be necessary to cut the deficit yet was simultaneously implemented with a cut in the corporation tax rate which reduced government revenues by almost exactly the same amount.
The popular shorthand for this is a recovery solely for the 1%. The class content is clear. The policy is designed to boost capital at the expense of labour and its allies.
Austerity is not at all designed to boost total economic output, in which capital might be one of the beneficiaries. The reason is simple. In the ordinary course of events an economic downturn or slump leads to a fall in profits far greater than the fall in output. A simple recovery in output could entrench that for a prolonged period.
So, the owners of a car firm sell cars worth £1,000 million in a year. Their main costs are all the inputs of labour, capital and raw materials amounting to £800 million. But these largely to tend to stay the same or even continue to rise a little when the downturn occurs. Suppose sales fall by 10% to £900 million. Input costs are unaltered in aggregate. Now profits are only £100 million and previously they were £200 million. On a 10% decline in sales, profits have fallen by 50%. Profits fall faster than output.
From the owners’ perspective the danger is that over the next period everything, sales and input costs all rise at the same rate. If so, once they have more or less recovered to £990 million in sales (an increase of 10%) the costs of labour, capital and raw materials will have risen in parallel by 10% to £880 million. Where the profit margin was previously 20% now it will be just 11%. Austerity policies are designed to avoid this permanent and unacceptable decline in the profit rate by pushing costs lower (or increasing unpaid labour though zero hours contracts, unpaid overtime, reduced pension benefits, etc.).
There is no shortage of capital to invest. SEB has previously shown that British firms are sitting on a cash mountain as are firms innearly all the Western economies. But it is imperative from their perspective to permanently lower costs, most especially labour costs before resuming investment.
To date this project has met with only limited success. Profits, as measured by the Gross Operating Surplus of firms is £14bn lower than in the first 3 quarters of 2008 when the slump began.
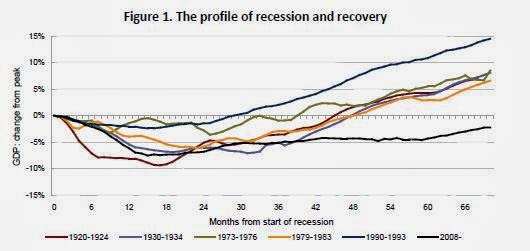
This explains the weakness of the recovery as firms continue their investment strike. The NIESR chart below will be familiar to many readers. It shows the current slump in relation to the most severe recessions of the 20th century. Although not as severe as the Great Depression the current crisis has lasted considerably longer. All prior slumps had led to a recovery after 4 years (48 months). By contrast the current downturn remains 2% below its pre-recession peak. It will be at last 6 years before there is a recovery of the previous level of output.
It may be useful to delve further back in history for comparison. Between 1879 and 1893 the British economy grew by just under 13% in what has become known as the Long Depression. Even if growth in the 4th quarter of 2013 was reasonably strong, for the year as whole GDP would be 2.5% below the level of 2007 a full 6 years later.
The current cycle is compared to the Long Depression in the chart below. For the time being, even this comparison is not encouraging as the current slump is currently more severe.
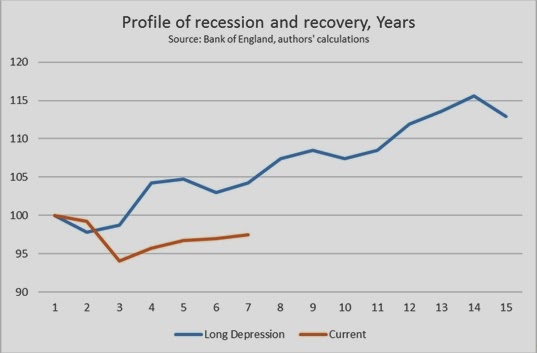 There can be no suggestion that any previous recession can be mechanically extrapolated in order to suggest the path from the current crisis. But the comparisons do provide a context for the both the severity and duration of the current slump. They also belie any nonsense from the supporters of austerity about the strength of the current recovery.
The recovery itself remains dependent on a revival in investment. This is not the same as an upturn in ‘demand’, which is comprised of both consumption and investment. Household consumption has almost completely recovered its prior peak and government consumption is at a new high. The fall in investment more than accounts for the entire fall in GDP. The fall in business investment alone (not including government or household investment) exceeds the fall in output.
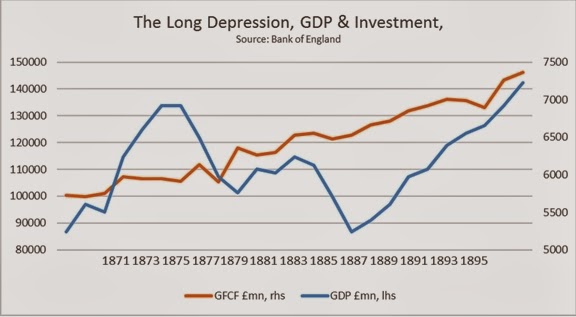
This is also true historically. After contraction the British economy crawled along at a snail’s pace for a further decade in the Long Depression. It only began to grow robustly from 1894 onwards. Through most of the Long Depression investment continued to decline. It was only when investment recovered its pre-recession peak in 1894 that the economy began to grow robustly. This relationship between growth and investment during the recession and recovery of the Long Depression is shown in the chart below.
 The structure of the British economy is very different now and so too is its weight and role in the world economy. Then increased exploitation of a growing colonial empire combined with increased military spending were key components of the recovery. Britain’s relative economic decline since then means that option is closed.
Even with increased imperial exploitation it required a full recovery in investment to end of the Long Depression. Unless and until there is a full and robust investment recovery the British economy is set to remain in an Osborne-recovery, weak and solely for the 1%.
First published on the Socialist Economic Bulletin on 8th January 2014